

Quota sampling method is a non-probability sampling and it can be defined as a sampling method of gathering representative data from a group. Application of quota sampling ensures that sample group represents certain characteristics of the population chosen by the researcher. Quota sampling can be divided into two groups: controlled and uncontrolled. Controlled quota sampling involves introduction of certain restrictions in order to limit researcher’s choice of samples. Uncontrolled quota sampling, on the other hand, resembles convenience sampling method in a way that researcher is free to choose sample group members according to his/her will. The main difference between quota and stratified sampling can be explained in a way that in quota sampling researchers use non-random sampling methods to gather data from one stratum until the required quota fixed by the researcher is fulfilled. Accordingly, the quota is based on the proportion of subclasses in the population. Application of Quota Sampling: an Example Let’s assume your research objective is to evaluate the impact of cross-cultural differences on employee motivation in Virgin Media in the UK. You need to assess the effectiveness of employee motivational tools taking into account gender differences among the workforce. Quota sampling can be applied in the following manner: 1. Dividing the population into specific groups. Virgin Media employees in the UK as the sampling frame need to be divided into the following five groups according to their cultural background: European Asian (India) Asian (China) Black (African) Other 2. Calculating a quota for each group. You supervisor confirms that in order to achieve research objectives, 30 representatives from each group and the total sample size of 150 respondents would be appropriate. 3. Determining specific condition(s) to be met and quota in each group Both genders, males and females need to be represented equally in your sample group. This is an important condition that has to…

Qualitative data analysis is the process of examining non-numerical data such as interviews, observations, documents, and open-ended responses in order to identify patterns, themes, meanings, and relationships. On this page: What is qualitative data analysis? When to use qualitative data analysis Categories of qualitative data analysis Qualitative data analysis steps Qualitative data analysis in the age of AI and digital research Method Main Purpose Key Feature Content analysis Categorise and summarise data Coding and classification Thematic analysis Identify patterns and themes Interpretation of meanings Narrative analysis Analyse stories and experiences Focus on individual experiences Discourse analysis Examine language and communication Context and meaning Framework analysis Structured thematic analysis Multi-stage analytical process Grounded theory Develop new theory Iterative and inductive Qualitative data analysis methods at glance What is Qualitative Data Analysis? Qualitative data analysis is the process of carefully examining non-numerical information in order to understand meanings, experiences, opinions, and behaviours. Instead of focusing on numbers and statistics, qualitative analysis focuses on words, ideas, emotions, and interpretations. Researchers usually begin by reading interview transcripts, observation notes, documents, or open-ended survey responses multiple times in order to become familiar with the data. During this process, they look for repeated ideas, important statements, similarities, differences, and patterns that appear across participant responses. After reviewing the data, researchers organise similar responses into categories or themes. For example, if several employees mention poor communication, lack of feedback, and unclear instructions during interviews, these responses may be grouped under a broader theme such as communication problems. The final stage of qualitative analysis involves interpreting the findings and explaining what they mean in relation to the research objectives and existing literature. Researchers attempt to understand not only what participants said, but also why they said it and what deeper meanings or experiences may be reflected…
Quantitative data analysis is the process of analysing numerical data in order to identify patterns, relationships, trends, and statistical significance. In business research, quantitative analysis is used to transform raw numerical information into meaningful findings that help answer research questions and test hypotheses. On this page: What is Quantitative Data Analysis? Statistical Software for Quantitative Analysis Important Aspects of Quantitative Data Analysis Quantitative Data Analysis in the Age of AI and Digital Research When to Use Quantitative Data Analysis Aspect Quantitative Data Analysis Type of data Numerical Main purpose Identify relationships, trends, and patterns Typical methods Correlation, regression, descriptive statistics Common tools Excel, SPSS, Access Main outcome Statistical findings and interpretation Quantitative data analysis at a glance What is Quantitative Data Analysis? Quantitative data analysis means analysing numerical data in order to understand what the data shows and what conclusions can be drawn from it. Researchers usually collect numerical data through methods such as questionnaires, surveys, experiments, financial reports, statistical databases, and business records. The collected data is then analysed using statistical techniques in order to identify trends, relationships, differences, frequencies, correlations, and patterns within the dataset. For example, a researcher may analyse whether employee motivation increases when communication between managers and employees improves. The main purpose of quantitative data analysis is not simply to present numbers or statistical outputs. Researchers are expected to explain what the findings mean within the context of the research problem and interpret results critically and logically. Not sure about right research methodology for your dissertation? Get a clear, justified methodology for your research topic in minutes Learn More About the Tool Statistical Software for Quantitative Analysis A set of analytical software can be used to assist with analysis of quantitative data. The following table illustrates the advantages and disadvantages of three popular…
Research limitations refer to the weaknesses or constraints that may affect the validity, reliability, or generalisability of a study. Limitations are a normal part of academic research and should be acknowledged honestly and critically in the dissertation On this page: What are Research Limitations? Research Limitation Points Research Limitations, AI and Modern Research Practices How to Address Research Limitations Aspect Research Limitations Research Delimitations Definition Constraints affecting the study Boundaries intentionally set by researcher Control level Often outside researcher’s full control Usually controlled by researcher Purpose Acknowledge weaknesses Define scope of study Example Small sample size Focusing on one industry or country Research limitations vs. delimitations (comparison table) What are Research Limitations? It is for sure that your research will have some limitations and it is normal. However, it is critically important for you to be striving to minimize the range of scope of limitations throughout the research process. Also, you need to provide the acknowledgement of your research limitations in conclusions chapter honestly. It is always better to identify and acknowledge shortcomings of your work, rather than to leave them pointed out to your by your dissertation assessor. While discussing your research limitations, don’t just provide the list and description of shortcomings of your work. It is also important for you to explain how these limitations have impacted your research findings. Not sure about research methodology for your dissertation? Get a clear, justified methodology for your research topic in minutes Learn More About the Tool Your research may have multiple limitations, but you need to discuss only those limitations that directly relate to your research problems. For example, if conducting a meta-analysis of the secondary data has not been stated as your research objective, no need to mention it as your research limitation. Research…
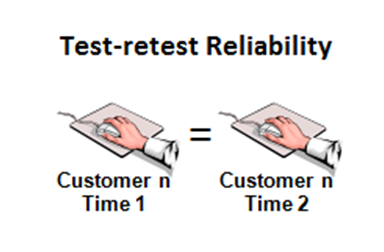
Reliability refers to whether or not you get the same answer by using an instrument to measure something more than once. In simple terms, research reliability is the degree to which research method produces stable and consistent results. A specific measure is considered to be reliable if its application on the same object of measurement number of times produces the same results. Research reliability can be divided into three categories: 1. Test-retest reliability relates to the measure of reliability that has been obtained by conducting the same test more than one time over period of time with the participation of the same sample group. Example: Employees of ABC Company may be asked to complete the same questionnaire about employee job satisfaction two times with an interval of one week, so that test results can be compared to assess stability of scores. 2. Parallel forms reliability relates to a measure that is obtained by conducting assessment of the same phenomena with the participation of the same sample group via more than one assessment method. Example: The levels of employee satisfaction of ABC Company may be assessed with questionnaires, in-depth interviews and focus groups and results can be compared. 3. Inter-rater reliability as the name indicates relates to the measure of sets of results obtained by different assessors using same methods. Benefits and importance of assessing inter-rater reliability can be explained by referring to subjectivity of assessments. Example: Levels of employee motivation at ABC Company can be assessed using observation method by two different assessors, and inter-rater reliability relates to the extent of difference between the two assessments. 4. Internal consistency reliability is applied to assess the extent of differences within the test items that explore the same construct produce similar results. It can be represented in two main formats. a)…

Grounded theory aims to discover problems in a given business environment and how parties involve handle these problems. Grounded theory aims to formulate, test and reformulate prepositions until a theory is developed. This approach refers to theory that is “grounded in or developed inductively from a set of data”[1] Grounded theory works in opposite way to traditional research and it may even appear to contradict scientific method. An inductive methodology, grounded theory methodology comprises the following four stages: Codes. Anchors are identified to collect the key points of data Concepts. Codes of similar content are collected to be able to group the data Categories. Broad groups of similar concepts are formed to generate a theory Theory. A collection of explanations are generated that explain the subject of the research (hypothesis) If you decide to apply grounded theory methodology in your dissertation, you have to decide how to select cases for your research. During the process of data analysis, the categories being developed will point to the new cases to be chosen for further data collection. Accordingly, in this type of research the purpose of sampling is to continue theoretical inquiry until theoretical saturation is reached, rather than to ensure representativeness of samples. Theoretical saturation is reached when data collection can no longer find new properties relevant to a category. Advantages of Grounded Theory Methodology Grounded theory is helpful to develop an understanding phenomena that cannot be explained with existing theories and paradigms. Appropriate application of this methodology in your dissertation is most likely to gain you high marks This methodology offers a systematic and rigorous process of data collection and data analysis. Therefore, research problem can be studied in a great level of depth. Application of this methodology in practice fosters creativity and critical thinking Disadvantages of Grounded Theory…
Case studies are a popular research method in business area. Case studies aim to analyze specific issues within the boundaries of a specific environment, situation or organization. According to its design, case studies in business research can be divided into three categories: explanatory, descriptive and exploratory. Explanatory case studies aim to answer ‘how’ or ’why’ questions with little control on behalf of researcher over occurrence of events. This type of case studies focus on phenomena within the contexts of real-life situations. Example: “An investigation into the reasons of the global financial and economic crisis of 2008 – 2010.” Descriptive case studies aim to analyze the sequence of interpersonal events after a certain amount of time has passed. Studies in business research belonging to this category usually describe culture or sub-culture, and they attempt to discover the key phenomena. Example: “Impact of increasing levels of multiculturalism on marketing practices: A case study of McDonald’s Indonesia.” Exploratory case studies aim to find answers to the questions of ‘what’ or ‘who’. Exploratory case study data collection method is often accompanied by additional data collection method(s) such as interviews, questionnaires, experiments etc. Example: “A study into differences of leadership practices between private and public sector organizations in Atlanta, USA.” Advantages of case study method include data collection and analysis within the context of phenomenon, integration of qualitative and quantitative data in data analysis, and the ability to capture complexities of real-life situations so that the phenomenon can be studied in greater levels of depth. Case studies do have certain disadvantages that may include lack of rigor, challenges associated with data analysis and very little basis for generalizations of findings and conclusions. My e-book, The Ultimate Guide to Writing a Dissertation in Business Studies: a step by step assistance…
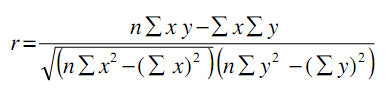
Methods of correlation and regression can be used in order to analyze the extent and the nature of relationships between different variables. Correlation analysis is used to understand the nature of relationships between two individual variables. For example, if we aim to study the impact of foreign direct investment (FDI) on the level of economic growth in Vietnam, then two variables can be specified as the amounts of FDI and GDP for the same period. Correlation coefficient ‘r’ is calculated through the following formula: Where, x and y are values of variables, and n is size of the sample. The value of correlation coefficient can be interpreted in the following manner: If ‘r’ is equal to 1, then there is perfect positive correlation between two values; If ‘r’ is equal to -1, then there is perfect negative correlation between two values; If ‘r’ is equal to zero, then there is no correlation between the two values. In practical terms, the closer the value of ‘r’ to 1, the higher positive impact of FDI on GDP growth in Vietnam. Similarly, if the value of ‘r’ is less than 0, the closer it is to – 1, the greater the negative impact of FDI on GDP growth in Vietnam. If ‘r’ is equal to zero, then FDI is perceived to have no impact on GDP change in Vietnama within the given sample. The most popular forms of correlation analysis used in business studies include Pearson product-moment correlation, Spearman Rank correlation and Autocorrelation. The Pearson product-moment correlation is calculated by taking the ratio of the sample of the two variables to the product of the two standard deviations and illustrates the strength of linear relationships. In Pearson product-moment correlation the correlation coefficient is not robust due to the fact that strong linear relationships between the…
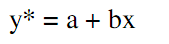
Regression analysis is a quantitative research method which is used when the study involves modelling and analysing several variables, where the relationship includes a dependent variable and one or more independent variables. In simple terms, regression analysis is a quantitative method used to test the nature of relationships between a dependent variable and one or more independent variables. The basic form of regression models includes unknown parameters (β), independent variables (X), and the dependent variable (Y). Regression model, basically, specifies the relation of dependent variable (Y) to a function combination of independent variables (X) and unknown parameters (β) Y ≈ f (X, β) Regression equation can be used to predict the values of ‘y’, if the value of ‘x’ is given, and both ‘y’ and ‘x’ are the two sets of measures of a sample size of ‘n’. The formulae for regression equation would be Where, Do not be intimidated by visual complexity of correlation and regression formulae above. You don’t have to apply the formula manually, and correlation and regression analyses can be run with the application of popular analytical software such as Microsoft Excel, Microsoft Access, SPSS and others. Linear regression analysis is based on the following set of assumptions: 1. Assumption of linearity. There is a linear relationship between dependent and independent variables. 2. Assumption of homoscedasticity. Data values for dependent and independent variables have equal variances. 3. Assumption of absence of collinearity or multicollinearity. There is no correlation between two or more independent variables. 4. Assumption of normal distribution. The data for the independent variables and dependent variable are normally distributed My e-book, The Ultimate Guide to Writing a Dissertation in Business Studies: a step by step assistance offers practical assistance to complete a dissertation with minimum or no stress. The e-book covers all stages of writing a dissertation…

Focus groups are group discussions conducted with the participation of 7 to 12 people to capture their experiences and views regarding specific issues closely related to research question(s). Focus groups data collection method is most suitable for types of studies where multiple perspectives needed to be obtained regarding the same problem. Focus groups are led by a moderator who is responsible to ensure that group discussions remain focused on the research area. Advantages of focus groups include the possibility of obtaining primary data through non-verbal channels, as well as, verbal channels and approaching the research area from various perspectives. As is it is the case with any other research method, focus gropes have some disadvantages as well. Group discussions may be heavily influenced by one or two dominant individuals in the group. Also, some members of focus group may be discouraged from participating in discussions due to lack of confidence or not articulate communication skills. Moreover, the nature of primary data obtained through focus groups are greatly influenced by environmental factors such as design of the room, room temperature, time of the day, etc. It is important to understand that data collection and data analysis using focus groups is much more difficult compared to questionnaires and interviews. You have to make sure that you fully understand these difficulties before making a final choice of primary data collection method. However, this is not to say that you should not use focus group to collect primary data for your dissertation. My e-book, The Ultimate Guide to Writing a Dissertation in Business Studies: a step by step assistance offers practical assistance to complete a dissertation with minimum or no stress. The e-book covers all stages of writing a dissertation starting from the selection of the research area to submitting the completed version of the…