

Amazon segmentation, targeting and positioning involves a set of activities aimed at determining specific groups of people as customers and developing products and services attractive to this group. Segmentation involves dividing population into groups according to certain characteristics, whereas targeting implies choosing specific groups identified as a result of segmentation to sell products to. Positioning refers to the selection of the marketing mix the most suitable for the target customer segment. Amazon mainly uses the following two types of positioning: Multi-segment positioning. Amazon offers a wide range of products and services, successfully exploiting more than one segment at the same time. Specifically, the online retail giant sells more than 75 million products, appealing to the needs and wants of a wide range of customer segments.[1] Adaptive positioning. The online retail giant closely monitors changes in external marketplace and addresses increasing customer expectations by periodically repositioning of products and services according to changes in the segment. Anticipatory positioning. This refers to positioning to a market segment that has low turnover with the anticipation that the turnover will increase in the future. Amazon Web Services (AWS) is a stark example for anticipatory positioning. Company’s founder and former CEO Jeff Bezos notes that “no one asked for AWS. No one. Turns out the world was in fact ready and hungry for an offering like AWS but didn’t know it”[2] Additional examples of anticipatory positioning applications by the e-commerce giant include Amazon Sage Maker, Amazon Comprehend and Amazon Rekognition. Stop-gap positioning This strategy involves investing in currently unprofitable brand due to profitability expectations on long-term perspective. The e-commerce giant applied stop-gap positioning strategy in relation to a number its brands such as Core 10, Happy Belly and Vedaka. The following table illustrates Amazon segmentation, targeting and positioning: Type of segmentation Segmentation criteria Amazon target…
PESTEL is a strategic analytical tool and the acronym stands for political, economic, social, technological, environmental and legal factors. Amazon PESTEL analysis involves the analysis of potential impact of these factors on the bottom line and long-term growth prospects of the e-commerce giant. Political Factors in Amazon PESTEL Analysis The range of political factors that affect Amazon include but not limited to the political stability or instability in the country, the influence of home market lobbying and pressure groups and the attitude of the government towards e-commerce and retail industries in particular. Additionally, the freedom of press, trade unions and their activities and the extent of corruption belong to the list of political factors with potential implications on Amazon business practices. Due to the scope and scale of its business operations, Amazon plays an indirect role in politics in USA, Europe and some other regions. In other words, in markets where Amazon has a strong presence, the ruling government usually has a certain stance towards the e-commerce giant in particular among internet retailers. Stance of governments towards Amazon Most people either love or hate Amazon and this extends to politicians and government officials as well. Former US President Donald Trump was vocal in his dislike of the tech giant and sometimes criticised the company and its then CEO Jeff Bezos on Twitter. The current President Joe Biden also criticizes Amazon for paying low taxes and its opposition towards formation of labour unions. In February 2021 Biden “released the 2 ½-minute video. While he omitted the name of the powerful e-commerce giant, his remarks were seen as an unmistakable show of solidarity with a labour movement that failed to secure anything similar from his recent predecessors.”[1] The company has hired the former press secretary of the US President, Jay…

Amazon marketing strategy relies on the following four pillars: 1. Offering the widest range of products. The largest internet retailer in the world by revenue offers hundreds of millions of products. The wide range of product it offers has earned the online retailer the moniker The Everything Store. 2. Using customer-friendly interface. The tech giant has an advanced interface that integrates personalized recommendations and recent browsing history, among others. Ever-improving user interface is the result of the company’s focus to become Earth’s most customer-centric company. 3. Scaling easily from small to large. The e-commerce and cloud computing company has experience and competence in scaling from small to large. This factor plays in instrumental role exploring new business segments. Scaling from small to large has allowed the online retail behemoth do disrupt increasing ranges of industries such as retail, transportation, entertainment and now industrial distribution. 4. Exploiting affiliate products and resources. Up to date, the tech giant has taken a full advantage of affiliate programs, products and resources to contribute to the bottom line of the business. Amazon marketing strategy integrates a number of targeted online marketing channels, such as Associates program, sponsored search, social and online advertising, television advertising, and other initiatives. Generally, Amazon marketing strategy is based on the following principles: Amazon 7ps of marketing mainly focuses on product and place elements of the marketing mix. Offering hundreds of millions of products in the USA alone, Amazon product range is the widest among online and offline retailers. Moreover, the company is able to offer its products for competitive prices due to massive cost savings based on online nature of business operations. Amazon segmentation targeting and positioning practices are associated with targeting the widest customer segment. The retail giant does this with the application of multi-segment, adaptive, anticipatory and stop-gap…

Amazon leadership style has been classified as pragmatist. Pragmatist leaders “set high standards and unapologetically expect those standards to be met by themselves and by their employees”[1] The company’s founder and first CEO, Jeff Bezos is an exceptional and proven business leader. Bezos efficiently exercises visionary and servant leadership styles and places exceptional customer service at the core of Amazon’s business practice. Moreover, Jeff Bezos leadership style is unique in several ways. For example, it has been noted that “while you might find other internet firms focusing on a fun, relaxed atmosphere for their employees, no-frills Bezos is proving the potency of another model: coddling his 164 million customers, not his 56,000 employees.”[2] Jeff Bezos’ leadership style can be analysed through the prism of contingency leadership theory. According to contingency leadership theory, “leader’s effectiveness is contingent upon with how his or her leadership style matches to the situation.”[3] Jeff Bezos leadership style has been characterized as harsh, cutthroat and demanding.[4] It can be argued that such a leadership style fitted the situation on the onset of the business, when the company had to strengthen its position on rapidly expanding industry. In July 2021 Jeff Bezos stepped down as CEO and assumed the role of company’s executive chairman. Andy Jassy CEO of Amazon Web Services became the new CEO of the online retail behemoth. At has been noted that although Andy Jassy values Bezos leadership style the new CEO is “more mild-mannered, soft-spoken and less prone to angry outbursts compared to Bezos”[5] Nevertheless, Mr. Bezos will continue to yield an immense influence on the business and Amazon leadership style for the foreseeable future. This is because his new role executive chairman grants his involvement in strategic decision making and Mr. Bezos remains as the largest shareholder of the e-commerce giant. Amazon…
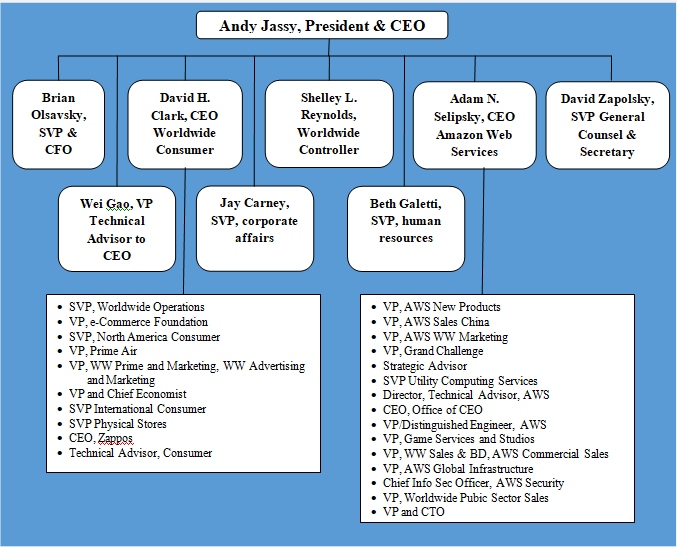
Amazon organizational structure can be classified as hierarchical. Senior management team include three CEOs and three senior vice presidents responsible for various vital aspects of the business reporting directly to CEO Andy Jassy. Amazon organizational structure has the following four key features: 1. Hierarchical corporate structure. Hierarchical structure at Amazon has developed due to the immense size of the business. The largest internet retailer in the world by revenue employs more than 1,3 million people worldwide.[1] 2. Hybrid project groups. Amazon corporate structure integrates hybrid project groups when developing new products and services. Specialists from various departments are attracted according to their skills and competencies required for the project. These employees can be attracted part-time reporting to both, the head of their departments and project leaders, or they can engage in the project full-time reporting to project manager only for the duration of the project. 3. Flexibility of the business. It is important to note that despite its large size, unlike many other companies with hierarchical organizational structure, Amazon remains highly flexible to adapt to frequent changes in the external marketplace. Moreover, the online retail giant leads changes in external business environment; it has caused disruptive innovation in e-commerce and currently it is about to cause a disruptive innovation in global logistics industry. Successful organization of hybrid project groups plays an instrumental role in maintaining flexibility of the business. Amazon organizational structure integrates many small teams that deal with various aspects of the business. Amazon founder and former CEO Jeff Bezos is credited with the introduction of ‘two pizza rule”. According to this rule, meetings should be held in teams small enough that could be all fed with only two pizzas. “Two pizza rule” continues to this day under the new CEO Andy Jassy. 4. Stability in the top management.…

Amazon business strategy can be described as cost leadership taken to the extreme. Range, price and convenience are placed at the core of Amazon competitive advantage. The global online retailer operates with a razor thin profit margin and succeeds due to a combination of economies of scale, innovation of various business processes and a constant business diversification. Founder and first CEO Jeff Bezos believes in focusing as a business strategy on things that do not change. At the outset of the business he reasoned that people always want low prices, selection and fast delivery. Exceeding customer expectations on these points has remained as the core of Amazon business strategy. Innovation and technology the online retail behemoth uses are simply instruments to pursue this core strategy. Moreover, Amazon business strategy is guided by four principles: customer obsession rather than competitor focus, passion for invention, commitment to operational excellence, and long-term thinking.[1] The following four points constitute the cornerstones of Amazon business strategy: 1. Regularly entering into new niches and segments. Started only as an online shop for selling physical books in 1997, today Amazon sells anything that can be sold online in the global scale. Sophisticated global logistics represents one of the solid bases of Amazon competitive advantage. The tech giant has used this advantage extensively to engage in successful business diversification. Recently, the company launched Amazon Home Services, a simple way to buy and schedule local professional services as a continuation of its diversification strategy.[2] Currently, the tech giant operates in increasing range of industries including e-commerce, cloud computing, artificial intelligence, consumer electronics, entertainment, digital distribution, B2B distribution, self-driving cars and supermarkets. As the largest internet company by revenue in the world, Amazon frequently disrupts the industries it chooses to enter. The e-commerce giant occasionally finds new niches and segments accidentally, while…
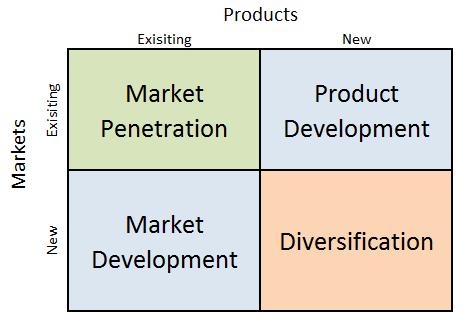
Amazon Ansoff Matrix is a marketing planning model that helps the e-commerce and cloud computing company to determine its product and market strategy. Ansoff Matrix illustrates four different strategy options available for businesses. These are market penetration, product development, market development and diversification. Amazon Ansoff Matrix Within the scope of Ansoff Matrix, Amazon uses all four growth strategies in an integrated manner: 1. Market penetration. Market penetration refers to selling existing products to existing markets. Amazon uses market penetration strategy aggressively. Sophisticated user experience features in general and recommendations feature on e-retailer’s website in particular play an important role in the application of market penetration strategy. Specifically, Amazon focuses on user experience personalization thanks to efficient application of data science and machine learning. The e-commerce giant collects and possesses a vast amount of data related to customers such as age, sex, lifestyle, habits and preferences. The company uses artificial intelligence (AI) to analyse this data and suggest products that a particular customer is highly likely to buy. 2. Product development. This involves developing new products to sell to existing markets. Product development is one of the core strategies used by Amazon. Started by Jeff Bezos selling only physical books online in 1997, today Amazon sells anything that can be sold online. The largest internet retailer in the world by revenue sells more than 500 million products, including products sold by third parties on Amazon platform. Top product categories include clothing, shoes, jewellery, home and kitchen appliances, books, electronic devices, sports and outdoor items and others. The e-commerce and cloud computing company produces increasing number of products under the private label as well. 3. Market development. Market development strategy is associated with finding new markets for existing products. Amazon is engaged in market development in a systematic manner. Started only in…

Non-probability sampling is a sampling method in which participants are selected using non-random criteria, meaning not all members of the population have a known or equal chance of being included in the study. On this page: What is Non-Probability Sampling? Types of Non-Probability Sampling Sample Size Considerations Advantages and Disadvantages Non-Probability Sampling in the Age of AI and Digital Research When to Use Non-Probability Sampling Aspect Non-Probability Sampling Probability Sampling Selection method Non-random Random Chance of selection Unknown Known and non-zero Bias level Higher Lower Representativeness More limited Higher Generalisability Usually limited Stronger Probability vs Non-Probability Sampling (comparison table) What is Non-Probability Sampling? Non-probability sampling prioritises practicality, whereas probability sampling prioritises representativeness. Non-probability sampling means: Participants are selected based on availability or judgement Not everyone in the population has a chance to be selected Results are quick to obtain but less generalisable It is mainly used for exploratory and qualitative research. In non-probability sampling (also known as non-random sampling) not all members of the population have a chance to participate in the study. In other words, this method is based on non-random selection criteria. This is contrary to probability sampling, where each member of the population has a known, non-zero chance of being selected to participate in the study. Necessity for non-probability sampling can be explained in a way that for some studies it is not feasible to draw a random probability-based sample of the population due to time and/or cost considerations. In these cases, sample group members have to be selected on the basis of accessibility or personal judgment of the researcher. Therefore, the majority of non-probability sampling techniques include an element of subjective judgement. Non-probability sampling is the most helpful for exploratory stages of studies such as a pilot survey. Not sure if non-probability sampling is…
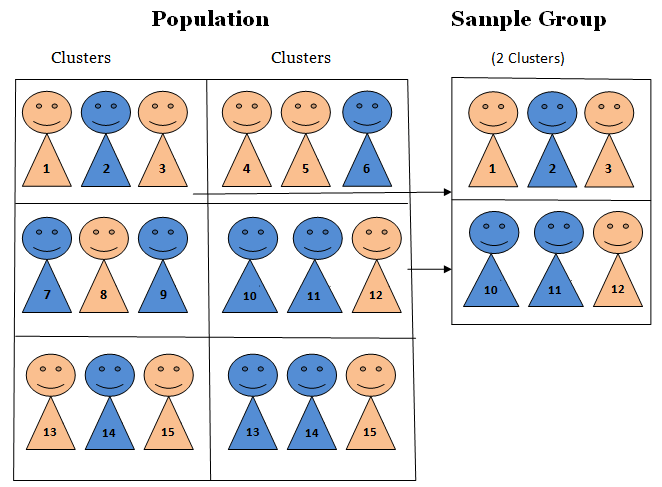
Cluster sampling (also known as one-stage cluster sampling) is a technique in which clusters of participants representing the population are identified and included in the sample[1]. This is a popular method in conducting marketing researches. The main aim of cluster sampling can be specified as cost reduction and increasing the levels of efficiency of sampling. This specific technique can also be applied in integration with multi-stage sampling. A major difference between cluster and stratified sampling relates to the fact that in cluster sampling a cluster is perceived as a sampling unit, whereas in stratified sampling only specific elements of strata are accepted as sampling unit. Accordingly, in cluster sampling a complete list of clusters represent the sampling frame. Then, a few clusters are chosen randomly as the source of primary data. Cluster sampling process can be single stage or multistage. In single stage sampling, all members of selected clusters are included in the study, whereas in multistage sampling additional sampling methods are used to choose certain individuals within selected clusters. Area or geographical sampling can be specified as the most popular version of cluster sampling. Specifically, a specific area can be divided into clusters and primary data can be collected from each cluster to represent the viewpoint of the whole area. The pattern of cluster analysis depends on comparative size of separate clusters. If there are no major differences between sizes of clusters, then analysis can be facilitated by combining clusters. Alternatively, if there are vast differences in sizes of clusters, probability sampling proportionate to sample size can be applied to conduct the analysis. Application of Cluster Sampling: an Example Imagine you want to evaluate consumer spending on various modes of transportation in Greater London. Since Greater London is a large area, we need to sample from only…
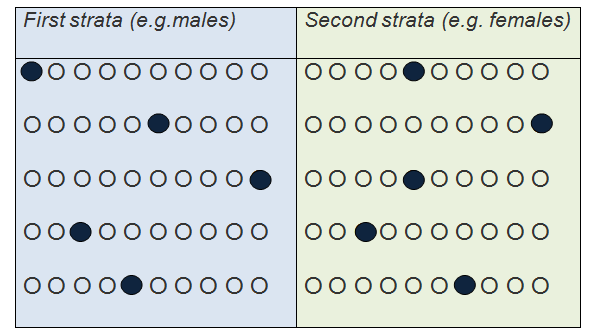
Stratified sampling is a probability sampling method and a form of random sampling in which the population is divided into two or more groups (strata) according to one or more common attributes. These attributes can be sex, age, income, level of education etc. according to aims and objectives of the study. Stratified random sampling intends to guarantee that the sample represents specific sub-groups or strata. Accordingly, application of stratified sampling method involves dividing population into different subgroups (strata) and selecting subjects from each strata in a proportionate manner. The figure below illustrates simplistic example where sample group of 10 respondents are selected by dividing population into male and female strata in order to achieve equal representation of both genders in the sample group. Stratified sampling can be divided into the following two groups: proportionate and disproportionate. Application of proportionate stratified random sampling technique involves determining sample size in each stratum in a proportionate manner to the entire population. For example, if the entire population for a research is 5000 people, in proportionate stratified random sampling the group can be divided into five strata with 1000 people in each stratum. In disproportionate stratified random sampling, on the contrary, numbers of subjects recruited from each stratum does not have to be proportionate to the total size of the population. If disproportionate stratified random sampling is applied in a research with 5000 people, the population can be divided into five strata with following unequal numbers of population in each stratum: 1000, 1500, 1200, 800 and 500. Accordingly, the application of proportionate stratified random sampling generates more accurate primary data compared to disproportionate sampling. Application of Stratified Sampling: an Example Suppose, your dissertation aims to explore leadership styles exercised by medium-level managers at Bayerische Motoren Werke Aktiengesellschaft (BMW AG). You have selected semi-structured in-depth…