
Toyota Motor Corporation is a global automobile manufacturing company that employs about 330,000 people. The company celebrated its 75th anniversary in 2012 and adherence to its mission statement “contributing to society by making ever-better cars” has taken the company to the global leadership in the industry in terms of sales. During the fiscal year of 2014, Toyota sold 9.116 million units of vehicles and generated revenues of ¥25.6919 trillion, which is an increase of ¥3,627.7 billion, or 16.4%, compared with the prior fiscal year. At the same time, it is important to clarify that revenues reported above were positively affected from a ¥900.0 billion boost due to exchange-rate fluctuations. Also, during the fiscal year of 2014, company expenses increased by ¥480.0 billion compared to the previous period. Senior management introduced massive changes to the business since 2009 immediately after the global financial and economic crisis. These include the reorganization of operations into four business units in 2013 and an extensive promotion of ‘One Toyota’ concept. The company has identified growth, efficiency and stability as three key priorities in its financial strategy. This report contains application of SWOT, PESTEL, Porter’s Five Forces and Value-Chain analytical frameworks towards the case study of Toyota Motor Corporation. The report also comprises analysis of Toyota’s marketing strategy and company’s approach towards Corporate Social Responsibility (CSR). 1. Introduction 2. Value-Chain Analysis 2.1 Primary Activities 2.2 Support Activities 3. SWOT Analysis 3.1 Strengths 3.2 Weaknesses 3.3 Opportunities 3.4 Threats 4. Marketing Strategy 4.1 Advertising 4.2 Sales Promotion 4.3 Events & Experiences 4.4 Public Relations 4.5 Direct Marketing 4.6 Personal Selling 5. PESTEL Analysis 5.1 Political Factors 5.2 Economic Factors 5.3 Social Factors 5.4 Technological Factors 5.5 Environmental Factors 5.6 Legal Factors 6. Porter’s Five Forces Analysis 7. Corporate Social Responsibility (CSR) 7.1 CSR Programs and Initiatives 7.2…

Realism research philosophy relies on the idea of independence of reality from the human mind. This philosophy is based on the assumption of a scientific approach to the development of knowledge. Realism can be divided into two groups: direct and critical. Direct realism, also known as naive realism, can be described as “what you see is what you get”[1]. In other words, direct realism portrays the world through personal human senses. Critical realism, on the other hand, argues that humans do experience the sensations and images of the real world. According to critical realism, sensations and images of the real world can be deceptive and they usually do not portray the real world.[2] An example of an optical illusion below can be used to illustrate the difference between direct and critical realism. Squares A and B appear to be different colours because of neighbouring contrasting squares, but actually they are the same colour. Direct realists would state that squares A and B have different colours, because this is what they see. Illustration of direct realism and critical realism[3] Critical realists, on the other hand, recognise that our senses and other factors may get in the way between us as researchers and researched reality. Therefore, critical realists may notice that squares A and B are actually the same colour. Direct realists accept the world as relatively unchanging. They concentrate on only one level, be it individual, group or an organization. Critical realists, on the other hand, appreciate the importance of multi-level study. Specifically, as a researcher following critical realism research philosophy you have to appreciate the influence and interrelationship between the individual, the group and the organization. The following are key characteristics of realism in research: Ontological realism. Belief in the existence of an objective reality independent of the observer. Epistemological realism. Belief that we can acquire knowledge about…
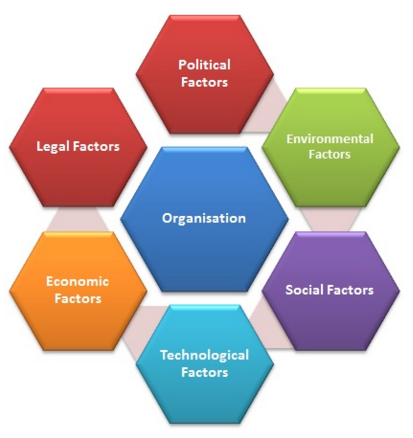
PESTEL is a strategic analytical tool used to assess external factors affecting businesses. PESTEL acronym stands for political, economic, social, technological, environmental and legal factors impacting companies. PESTEL has recently evolved from PEST analysis once intensifying forces of globalization and intensifying forces of competition in the marketplace coupled with other set of factors increased the importance and potential impact of environmental and legal factors on businesses. The majority of resources explain the application of PESTEL assuming their audience is business owners. This article adopts an alternative approach and below is the explanation of the framework for business students who have been assigned by their educational institution to conduct PESTEL analysis. Application of PESTEL as a part of your assignment can be facilitated via the following steps: Step 1: Data Collection If you have a choice, you should select a multinational corporation as a case study company to conduct PESTEL analysis due to the availability of relevant data about famous multinational enterprises. Company annual report along with official website of the company is the most comprehensive source of data needed to conduct PESTEL analysis. Additionally, you can purchase a company report on this portal. The portal offers reports about the most famous multinational enterprises and repots contain PESTEL analysis of respective companies. Online versions of the most popular business journals and magazines such as Wall Street Journal, The Economist and Inc. are also effective sources data to be used for your analysis. Step 2: Deciding which factors to discuss There is a vast range of political, economic, social, technological, environmental and legal factors that effect the company you have chosen as a case study. You do not have the space to discuss all of these factors in your paper; therefore, you will have to choose the most significant factors…
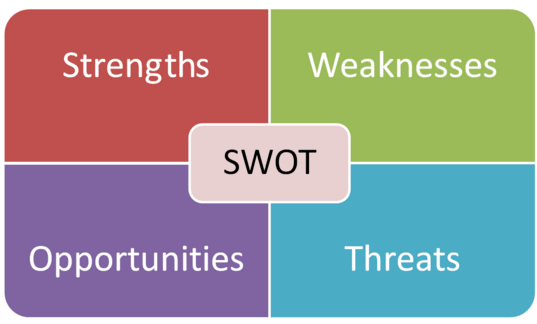
All business students are assigned to conduct SWOT analysis, usually at the earlier stages of their studies. This page focuses on the application of SWOT analysis in a business context as a part of academic assignments. This is a comprehensive SWOT resource and it contains an explanation of SWOT theory, an illustration of how to do a SWOT analysis and links to examples of SWOT analysis of major multinational brands. Moreover, SWOT analysis template further below can be used to generate SWOT tables of top multinational companies along a range of industries. SWOT Analysis: Theory SWOT is a strategic analytical tool for assessing strengths and weaknesses of a business, analyzing opportunities available to the business, as well as, threats faced by the business. SWOT analysis can be used at organizational and personal levels. As it is illustrated below, strengths and weaknesses are internal, i.e. businesses are able to influence and to manipulate with their strengths and weaknesses. Opportunities and threats, on the other hand, are external. It means businesses can only react to opportunities and threats and they do not have any means to influence opportunities and threats. Internal Strengths: attributes, characteristics and factors that give competitive advantage to the business. For example, considerable brand value of the business, cash reserves, first mover advantage and exclusive access to unique resources are major strengths that contribute to competitive advantage of the business. Weaknesses: attributes, characteristics and factors that weaken competitiveness of the business in the marketplace. A history of defective products, presence of huge debts and high employee turnover are examples for major weaknesses that a company may have. External Opportunities: favorable situations and factors that can strengthen competitive advantage of the business or provide the business with new sources of competitive advantage. The list of major opportunities for a…
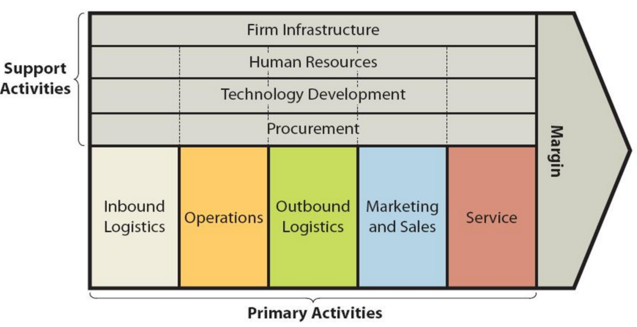
Value chain analysis is a strategic analytical and decision-support tool that highlights the bases where businesses can create value for their customers. The framework can also be applied to identify sources of competitive advantage for businesses. Value chain is a set of consequent activities that businesses perform in order to achieve their primary objective of profit maximization. Most sources explain the essence and application of value chain analysis assuming their audience is businesses aiming to increase the level of their competitiveness. Here, we adopt an alternative approach. Below is an explanation of value chain analysis for business students who have been assigned to apply this strategic analytical tool as part of assignment given by their educational institution. Theory of Value Chain Analysis The concept value chain analysis was introduced by Michael Porter in 1985[1] and its significance and relevance to strategic management and marketing has not diminished during 30 years of its existence. The framework divides activities that generate value into two categories – primary activities and support activities. Primary activities comprise a set of activities that contribute to the creation of value in a direct manner. Support activities consist of functions and tasks that are intended to support primary activities. It is important to clarify that the relevance of value chain analysis is not limited to manufacturing businesses and the framework can be applied towards service firms as well. Primary Activities Inbound logistics involve receiving and storing raw materials and their usage in manufacturing as the necessity arises. Operations relate to the processes of transforming raw materials into finished goods. For businesses operating in services sector operations relate to the process of providing the service. Outbound logistics is associated with warehousing and distribution of finished products. Marketing and sales refer to the choice and implementation of marketing strategy to communicate…
Strategy is “means to ends, and these ends concern the purpose and objectives of the organization”[1]. Strategy is “used in business to describe how an organization is going to achieve its objectives”[2]. It has been noted that “strategy is about marshalling the gross resources of the organization to match the needs of the marketplace and achieve the business objective, this cannot be a short-term activity”[3]. In simple terms, business strategy “consists of what management decides about the future direction and scope of the business”[4]. There is a wide range of strategic analytical tools, models and frameworks that can assist with the various aspects of development and implementation of business strategy. These include the following: Gaps Model of Service Quality Greenfield investment McKinsey 7s Model New market entry strategies PESTEL analysis Porter’s Five Forces analysis Strategy as Revolution SWOT analysis “Think Globally, Act Locally”: a critical analysis Value chain analysis Some of the above (hyperlinked) are explained in this portal. The list above is going to be regularly expanded to include in-depth explanation of the most important strategic analytical tools, models and frameworks. [1] Thompson, J.L. & Martin, F. (2010) “Strategic Management: Awareness & Change” Cengage Learning [2] Sekhar, G.V.S. (2010) “Business Policy and Strategic Management” I.K. International Pvt Ltd [3] Fiflied, P. (2012) “Marketing Strategy” 3rd edition, Routledge [4] Rao, C.A., Rao, B.P. & Rao, K. (2009) “Strategic Management and Business Policy: Text and Cases” Excel Books
Theory can be defined as “a formal logical explanation of some events that includes predictions of how things relate to one another”[1]. Concepts are “collectives used to label certain bits of experience. In other words, they are elementary constructs by which reality is classified and categorised”[2]. Alternatively, concepts are “mental constructs or images developed to symbolise ideas, persons, things, or events”[3] Model can be defined as “a set of ideas and numbers that describe the past, present or future state of something”[4] A framework is “a system of rules, laws, agreements, etc. that establish the way that something operates”[5] A tool is “a thing used to perform a job”[6]. There are many theories, concepts, models, frameworks and tools in the area of business that you will have to use at some stage of your studies. The following are the most popular ones listed in alphabetical order: Change Kotter’s Eight Steps Model Lewin’s Force-Field Theory of Change Lewin’s Model of Change Consumer behavior Behaviorist approach to consumer behavior Cognitive approach to consumer behavior Consumer buyer behavior Consumer decision making process Customer perceived value Economic Man approach to consumer behavior Model of Goal Directed Behavior Psychodynamic Approach to consumer behavior Theory of Trying Corporate Social Responsibility Approaches to CSR Carrol’s CSR Pyramid Code of Ethics Culture Cross-cultural competencies Cross-cultural management Elements of organizational culture Harrison’s Model of Culture Hofstede’s Cultural Dimensions Trompenaars and Hampden-Turner Cultural Dimensions Economics Foreign Direct Investment Inter-industry and intra-industry trade Liberal and coordinated market economies Specialization for developing countries Theory of absolute advantage Theory of comparative advantage Human Resources Management Cognitive Theory of Training Transfer Continuous Professional Development Equity Theory of Motivation Employee training and development Forms of training transfer Frederick Hertzberg’s Two Factor Theory Hertzberg’s Motivation and Hygiene Factors Honey and…
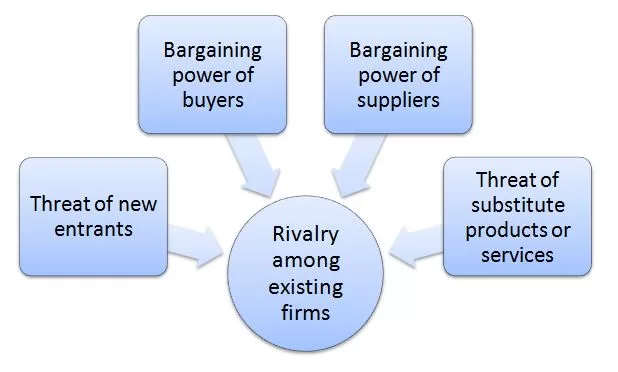
Porter’s Five Forces is a strategic analytical tool that is used to assess the level of intensity of competition in the industry. The tool can also be applied to evaluate the balance of power in the industry. Developed by a famous strategy guru Michael Porter[1], the framework assumes that the level of intensity of competition in the industry. Threat of new entrants High level of profit in a market or industry attracts new companies to join the industry affecting the level and pattern of competition in the marketplace. Theoretically, firms should be able to enter and exit to maintain the nominal level of profits. In practice, however, there is a range of factors that may emerge as a barrier for firms aiming to enter an industry. Specifically, the threat of new entrants depends on the following set of factors: Economies of scale. Product differentiation Capital requirements. Customer switching costs Access to distribution channels Legal and regulatory barriers Expected retaliation from existing businesses Time of entry Specialist knowledge Cost advantages Technology protection Bargaining power of buyers Buyer bargaining power is associated with the extent of impact customers can have on the industry. The stronger the buyer, the greater his ability to reduce prices and/or increase the quality of products and services. The following set of factors determine bargaining power of buyers: Size and concentration of buyers compared to suppliers Buyers’ price sensitivity Product differentiation Switching costs Information about products and services Buyer’s ability to go for substitute products and services Bargaining power of suppliers Supplier bargaining power forms the nature of supplier-manufacturer relationships. Suppliers with strong bargaining power are able to sell raw materials for higher prices with direct implications on the levels of profit to be generated by manufacturers. Supplier bargaining power depends on the following:…

Data analysis is the process of organising, interpreting, and examining collected data in order to answer research questions and achieve research objectives. It involves identifying patterns, relationships, and insights from qualitative or quantitative data. On this page: What is Data Analysis? Qualitative vs Quantitative Data Analysis When to Discuss Data Analysis Aspect Qualitative Data Analysis Quantitative Data Analysis Data type Text, images, observations Numbers, measurements Approach Interpretative Statistical Goal Understand meanings Test relationships Techniques Thematic analysis, coding Descriptive & inferential statistics Output Themes, insights Tables, charts, models Qualitative vs quantitative data analysis at a glance Qualitative analysis explains meaning, whereas quantitative analysis measures relationships. What is Data Analysis? Data analysis means: Organising your data Identifying patterns and trends Interpreting what the data means It answers the question:“What do the results show?” Methodology chapter of your dissertation should include discussions about the methods of data analysis. You have to explain in a brief manner how you are going to analyze the primary data you will collect employing the methods explained in this chapter. Qualitative vs Quantitative Data Analysis There are differences between qualitative data analysis and quantitative data analysis. In qualitative researches using interviews, focus groups, experiments etc. data analysis is going to involve identifying common patterns within the responses and critically analyzing them in order to achieve research aims and objectives. Data analysis for quantitative studies, on the other hand, involves critical analysis and interpretation of figures and numbers, and attempts to find rationale behind the emergence of main findings. Comparisons of primary research findings to the findings of the literature review are critically important for both types of studies – qualitative and quantitative. Data analysis methods in the absence of primary data collection can involve discussing common patterns, as well as, controversies within secondary data directly related…

Mean, mode and median are popular quantitative research methods used in business, as well as, engineering and computer sciences. In business studies these methods can be used in data comparisons such as comparing performances of two different businesses within the same period of time or comparing performance of the same business during different time periods. Mean implies average and it is the sum of a set of data divided by the number of data. Mean can prove to be an effective tool when comparing different sets of data; however this method might be disadvantaged by the impact of extreme values. Mode is the value that appears the most. A given set of data can contain more than one mode, or it can contain no mode at all. Extreme values have no impact on mode in data comparisons, however, the effectiveness of mode in data comparisons are compromised in the presence of more than one mode. Median is the middle value when the data is arranged in numerical order. It is another effective tool to compare different sets of data, however, the negative impact of extreme values is lesser on median compared to mean. My e-book, The Ultimate Guide to Writing a Dissertation in Business Studies: a step by step assistance offers practical assistance to complete a dissertation with minimum or no stress. The e-book covers all stages of writing a dissertation starting from the selection to the research area to submitting the completed version of the work within the deadline. John Dudovskiy