
Inter-Rater Reliability
Inter-rater reliability is the extent to which two or more people who rate, code or classify the same material independently reach the same judgements. In a dissertation it matters whenever your data depend on human judgement: coding interview transcripts, classifying documents, scoring observations or rating open-ended survey answers. If another trained coder would have coded your data differently, your findings partly reflect who did the coding rather than what the data contain.
For a dissertation, the practical question is not simply “is my coding reliable?” It is:
Does my analysis need an agreement check at all, which statistic fits my ratings, and how will I report the result honestly to my examiner?
This page explains percent agreement and Cohen’s kappa, shows how to choose between kappa, Fleiss’ kappa, weighted kappa, Krippendorff’s alpha and the intraclass correlation, works through a full calculation with two coders, and gives wording you can adapt for your methodology chapter. It complements the broader page on research reliability and the pages on Cronbach’s alpha and McDonald’s omega, which deal with a different question: whether the items of a scale measure the same thing.
On this page:
- Inter-Rater Reliability Explained Simply
- Percent Agreement and Why It Is Not Enough
- Cohen’s Kappa: How It Works
- Choosing the Right Statistic
- Worked Example: Two Coders, 60 Interview Excerpts
- When Kappa Misleads
- Inter-Rater Reliability in Qualitative Research
- How to Run an Inter-Rater Reliability Check
- What to Write in Your Methodology Chapter
- Inter-Rater Reliability in Business Research
- Common Mistakes
- Inter-Rater Reliability in the Age of AI and Digital Research
- Exam Tip
- References
Inter-Rater Reliability Explained Simply
Imagine two students analysing the same 60 interview excerpts in which employees explain why they left their jobs. Each student labels every excerpt as mainly about pay, management or workload. If they agree on almost every excerpt, a reader can trust that the coding scheme, not the personal view of one coder, produced the categories. If they agree on only half, the labels are partly a matter of opinion, and any conclusion about why employees leave rests on unstable ground.
Inter-rater reliability puts a number on that agreement. It is sometimes called inter-coder reliability (in content and qualitative analysis), inter-observer agreement (in observation studies) or rater agreement. It is different from intra-rater reliability, which asks whether the same person gives the same judgement on two occasions, and from internal consistency, which asks whether the items of a questionnaire scale hang together.
Agreement between coders is evidence of consistency, not of correctness. Two coders can agree perfectly and both be wrong if the coding scheme itself is poorly defined. Inter-rater reliability therefore supports, but does not replace, the arguments about validity you make elsewhere in your methodology chapter.
Percent Agreement and Why It Is Not Enough
The simplest measure is percent agreement: the number of items on which the coders agree divided by the total number of items. It is easy to calculate and easy to explain, and it remains worth reporting. Its weakness is that some agreement happens by chance. If two coders each label most excerpts “pay”, they will agree on many excerpts even if they are guessing.
Cohen (1960) introduced kappa to correct for this chance agreement. McHugh (2012) explains that percent agreement was the traditional measure and that kappa was developed because raters may guess on at least some items. Her practical advice is to calculate both percent agreement and kappa, because together they show more than either does alone.
Cohen’s Kappa: How It Works
Cohen’s kappa compares the agreement the coders actually achieved with the agreement expected by chance, given how often each coder used each category:
κ = (po − pe) / (1 − pe)
Here po is the observed proportion of agreement and pe is the proportion of agreement expected by chance. A kappa of 1 means perfect agreement. A kappa of 0 means agreement no better than chance, and a negative kappa means agreement worse than chance. Kappa is always lower than percent agreement unless agreement is perfect, because it removes the part that chance would have produced anyway.
Cohen’s kappa is designed for two coders who each assign every item to one of a set of categories that have no order. Variants handle other situations: weighted kappa (Cohen, 1968) gives partial credit for near-misses on ordered categories, and Fleiss (1971) generalised kappa to studies in which each item is rated by the same number of raters, who need not be the same people for every item.
The most widely quoted labels for kappa come from Landis and Koch (1977):
| Kappa | Landis and Koch (1977) label |
|---|---|
| Below 0.00 | Poor |
| 0.00 to 0.20 | Slight |
| 0.21 to 0.40 | Fair |
| 0.41 to 0.60 | Moderate |
| 0.61 to 0.80 | Substantial |
| 0.81 to 1.00 | Almost perfect |
Treat these labels with caution. McHugh (2012) argues that this scale may be too lenient for health-related studies because it implies that a kappa as low as 0.41 could be acceptable, and she states that any kappa below 0.60 indicates inadequate agreement. O’Connor and Joffe (2020) go further and remind researchers that all such guidelines are “ultimately arbitrary”. The sensible approach for a dissertation is to decide your minimum before you start, justify it by how much depends on the coding, and report the actual value with its confidence interval rather than a label alone.
Choosing the Right Statistic
The right statistic depends on two things: what kind of ratings your coders produce, and how many coders rate each item. The figure below is a guide to the common choices, not a rule; your design may have features that call for specialist advice.
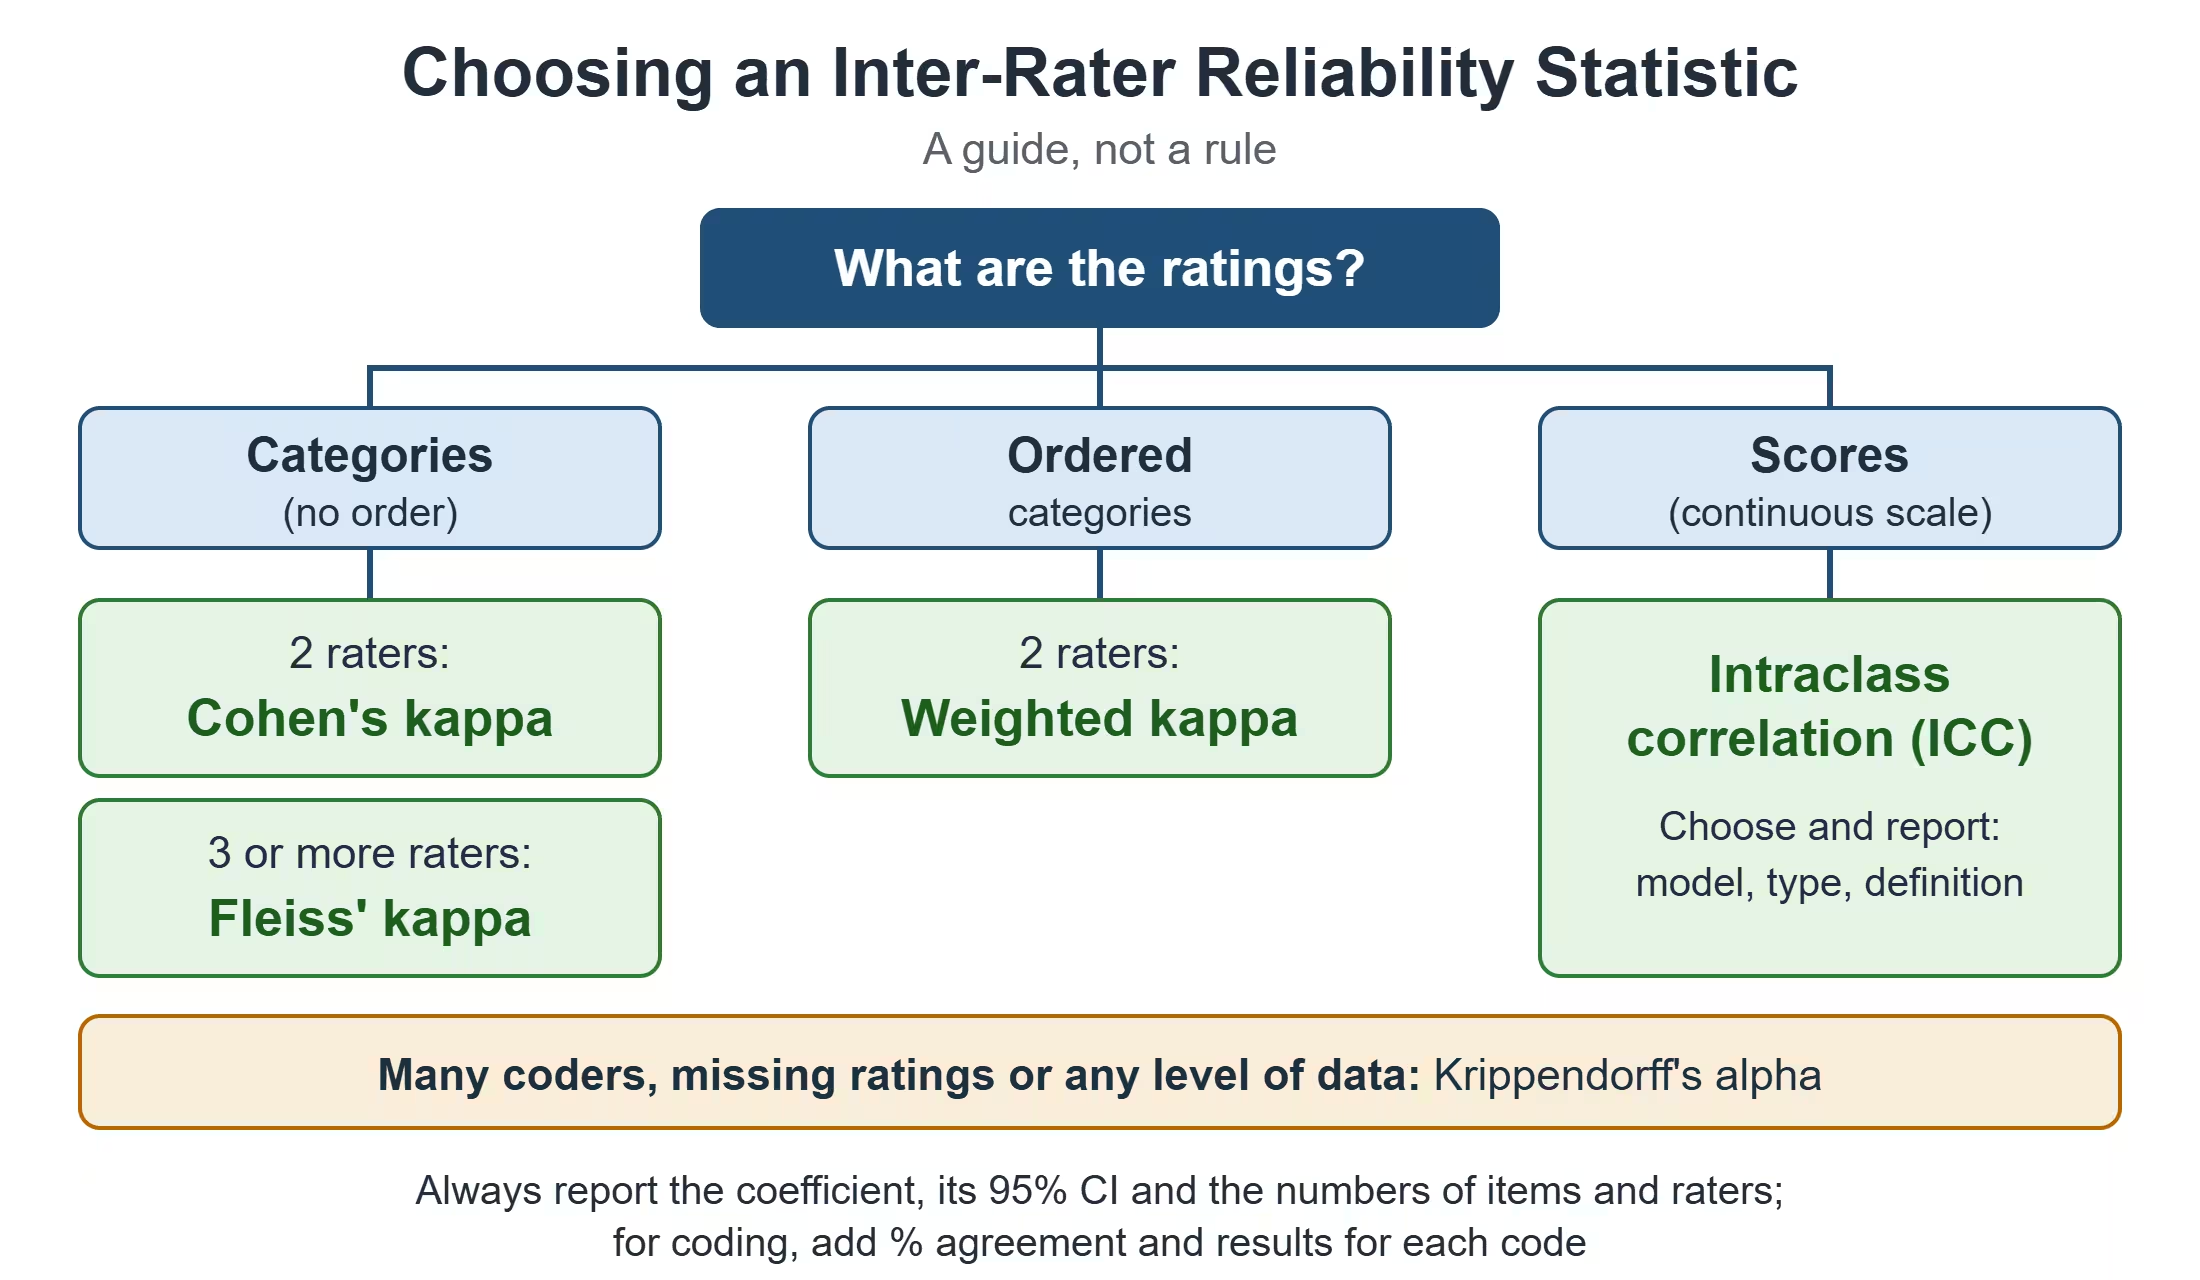
| Statistic | Type of ratings | Number of raters | Typical dissertation use |
|---|---|---|---|
| Percent agreement | Categories | Usually 2 | Report alongside a chance-corrected statistic, not on its own |
| Cohen’s kappa | Categories with no order | 2, the same pair for every item | Two coders applying a coding frame to interview or document extracts |
| Weighted kappa | Ordered categories (for example low, medium, high) | 2 | Two raters scoring the quality or intensity of responses on a short ordered scale |
| Fleiss’ kappa | Categories with no order | 3 or more, the same number for every item | A team of coders classifying social media posts or open-ended answers |
| Krippendorff’s alpha | Nominal, ordinal, interval or ratio | Any number, missing ratings allowed | Content analysis with several coders, or when not every coder rated every item |
| Intraclass correlation (ICC) | Continuous scores | 2 or more | Judges scoring presentations, essays or observed behaviour on a numerical scale |
Hayes and Krippendorff (2007) propose Krippendorff’s alpha as a standard measure because it can be used with any number of observers, with or without missing data, and with nominal, ordinal, interval or ratio data. They also criticise Cohen’s kappa, noting that it is limited to two observers and nominal data and that systematic disagreements between coders can inflate its value. Kappa nevertheless remains the statistic most supervisors and examiners expect to see for two coders and simple categories, so the choice between them should follow your design rather than fashion.
For continuous scores, the intraclass correlation is the usual choice, but it comes in several forms. Shrout and Fleiss (1979) set out six forms for studies in which a set of targets is rated by several judges, and Koo and Li (2016) describe ten. Koo and Li recommend reporting the software used and the three choices behind the ICC: the model (one-way random, two-way random or two-way mixed effects), the type (a single rater or the mean of several raters) and the definition (consistency or absolute agreement), together with the 95% confidence interval. They classify values below 0.50 as poor, 0.50 to 0.75 as moderate, 0.75 to 0.90 as good and above 0.90 as excellent, and they advise basing the judgement on the confidence interval rather than the point estimate. As a rule of thumb, they suggest at least 30 heterogeneous subjects and at least three raters where possible.
Two statistics that look tempting are not suitable. A Pearson correlation measures whether two raters’ scores rise and fall together, not whether they agree: if one rater always scores ten points higher than the other, the correlation can be perfect while the raters never agree. Cronbach’s alpha measures the internal consistency of scale items, not agreement between people. Hallgren (2012) provides a readable overview with SPSS and R syntax for computing kappa and intraclass correlations, which is useful if you are doing the calculation yourself.
Worked Example: Two Coders, 60 Interview Excerpts
A student studying employee turnover codes 60 interview excerpts into three categories: pay, management and workload. A second coder, trained on the same coding frame but not shown the student’s codes, codes the same 60 excerpts independently. The results are cross-tabulated below. The figures are invented for illustration.
| Coder A \ Coder B | Pay | Management | Workload | Total (A) |
|---|---|---|---|---|
| Pay | 20 | 3 | 2 | 25 |
| Management | 2 | 15 | 3 | 20 |
| Workload | 1 | 2 | 12 | 15 |
| Total (B) | 23 | 20 | 17 | 60 |
Step 1: observed agreement. The coders agree on the diagonal cells: 20 + 15 + 12 = 47 excerpts. So po = 47 / 60 = 0.783, or 78.3% agreement.
Step 2: agreement expected by chance. For each category, multiply the two coders’ totals and divide by the square of the number of excerpts: (25 × 23 + 20 × 20 + 15 × 17) / 60² = (575 + 400 + 255) / 3,600 = 1,230 / 3,600 = 0.342.
Step 3: kappa. κ = (0.783 − 0.342) / (1 − 0.342) = 0.441 / 0.658 = 0.67.
Step 4: precision. With only 60 excerpts the estimate is imprecise. A simple large-sample approximation gives a 95% confidence interval of about 0.51 to 0.83; statistical software may give a slightly different interval.
Step 5: agreement for each code. A pooled kappa can hide weak codes, and O’Connor and Joffe (2020) recommend reporting results code by code. A simple way to do this is specific agreement: twice the number of agreements for a code divided by the total number of times both coders used it. Pay gives 2 × 20 / (25 + 23) = 0.83, management gives 2 × 15 / (20 + 20) = 0.75, and workload gives 2 × 12 / (15 + 17) = 0.75.
Interpretation. A kappa of 0.67 is “substantial” on the Landis and Koch labels and above McHugh’s minimum of 0.60, but the lower end of the confidence interval (0.51) falls below that minimum. Management and workload are the weaker codes, and the off-diagonal cells show where the confusion lies: three excerpts coded “management” by Coder A were coded “workload” by Coder B. A careful student would clarify the boundary between those two codes in the coding frame, recode a fresh subsample and report both rounds. For comparison, Krippendorff’s alpha for the same data (nominal level) is also 0.67, as it usually is when two coders rate every item and use the categories at similar rates.
When Kappa Misleads
Kappa depends on how often each category occurs. When one category dominates, chance agreement is high, and kappa can be low even when the coders agree on almost everything. Feinstein and Cicchetti (1990) called this “high agreement but low kappa”.
Suppose two coders mark 100 excerpts for whether they mention artificial intelligence. Both say “no” on 85 excerpts, both say “yes” on 5, and they disagree on 10. Agreement is 90%, but because “no” is so common, chance agreement is 0.82 and kappa is only 0.44. If the same 90% agreement occurred with the two categories evenly split (45 “yes”, 45 “no”, 10 disagreements), chance agreement would be 0.50 and kappa would be 0.80. The coders are equally consistent in both cases; only the distribution of the code differs.
Three practical lessons follow. Report percent agreement alongside kappa, as McHugh (2012) advises. Report the frequency of each code, so readers can see when a low kappa reflects a rare category. And interpret kappa with its confidence interval and the number of items, since small samples produce wide intervals.
Inter-Rater Reliability in Qualitative Research
Whether qualitative studies should measure inter-rater reliability at all is a genuine debate, and your methodology chapter should show that you know it. O’Connor and Joffe (2020) set out both sides. Supporters argue that an inter-coder check makes coding more systematic, transparent and communicable, encourages reflexivity and dialogue in a team, and helps convince audiences of the trustworthiness of the analysis. Critics argue that measuring agreement conflicts with the interpretive aims of much qualitative research and that a number can give a false sense of precision.
The check fits some approaches better than others. It is most established in content analysis and in codebook or coding-reliability styles of thematic analysis, where a fixed coding frame is applied to the data. It fits poorly with reflexive thematic analysis: Braun and Clarke (2021) argue against treating coding-reliability measures as universal quality requirements, because in reflexive approaches the researcher’s interpretation is part of the analysis rather than an error to be removed. Some grounded theorists also regard it as inappropriate for an iterative, recursive analysis.
The practical conclusion for a dissertation is to match the decision to your approach. If you use a structured coding frame and claim that the codes capture identifiable features of the data, an agreement check strengthens your case. If you use a reflexive approach, it is usually better to explain why agreement statistics do not fit and to demonstrate quality in other ways, such as a reflexive account and a transparent audit trail, discussed on the page on trustworthiness in qualitative research.
How to Run an Inter-Rater Reliability Check
The steps below follow the practical guidance of O’Connor and Joffe (2020), adapted for a single-student dissertation in which a second person codes only part of the data.
- Decide in advance. Before coding, record the number of coders, the share of data to be double-coded, the unit of coding (sentence, paragraph or response), the statistic and the minimum value you will accept.
- Choose a second coder and train them. At least two independent coders are needed. A fellow student or colleague can code a sample; brief them on the coding frame with examples, but do not show them your codes.
- Select a sample. O’Connor and Joffe describe 10 to 25% of data units as typical, chosen randomly or by another justifiable criterion so that the sample represents the whole data set.
- Code independently. Give the second coder a clean copy of the material, divided into the same units but without codes, so that neither coder sees the other’s decisions.
- Calculate code by code. Compute the statistic for each code as well as overall, because a pooled figure can hide codes that perform poorly.
- Discuss, revise and retest. Discuss disagreements on codes below your threshold, sharpen or merge the definitions, and retest the revised frame, preferably on a different subsample.
- Finalise and report. Resolve the remaining disagreements by discussion, code the full data set with the final frame, and report both the initial and the final agreement.
What to Write in Your Methodology Chapter
A good reliability paragraph states what was checked, by whom, on how much data, with which statistic and against which threshold, and then reports the result honestly. The template below uses the figures from the worked example.
“To assess the reliability of the coding, a second coder, trained on the coding frame but not involved in the initial coding, independently coded a random sample of 60 of the 400 interview excerpts (15%). Agreement was assessed with Cohen’s kappa, which corrects for chance agreement, and percent agreement was reported alongside it (McHugh, 2012). A minimum kappa of 0.60 was set in advance. Initial agreement was 78.3% (κ = 0.67, 95% CI 0.51 to 0.83). Agreement was lower for the management and workload codes (specific agreement 0.75 for both) than for pay (0.83). After discussion, the boundary between management and workload was clarified in the coding frame, a fresh sample of 40 excerpts was coded, and the final agreement is reported in Appendix C. Remaining disagreements were resolved by discussion before the full data set was coded.”
Adapt the wording to your own design. If you used Krippendorff’s alpha or an ICC, name the version, and for an ICC report the model, type and definition as Koo and Li (2016) recommend. If you did not check inter-rater reliability because your approach is reflexive, say so explicitly and explain how quality was established instead.
Inter-Rater Reliability in Business Research
Many business dissertations rely on human judgement even when they look quantitative. Students code corporate social responsibility disclosures in annual reports, classify customer complaints or online reviews, rate the tone of press releases, or score candidates in simulated selection interviews. In each case, the conclusions about firms or customers depend on the categories applied, so an agreement check is a direct way to show that the categories are not one person’s opinion.
Two features of business research deserve attention. First, coding frames are often adapted from published indices, such as disclosure checklists. An agreement check shows that the adapted frame can be applied consistently to your documents, which is a question the original authors cannot answer for you. Second, some codes in business data are rare, such as mentions of a specific risk in annual reports. As the earlier example shows, rare codes depress kappa, so report code frequencies and percent agreement with the coefficient.
Common Mistakes
- Reporting percent agreement alone. It ignores chance agreement and can look impressive when one category dominates.
- Using Pearson’s correlation or Cronbach’s alpha to measure agreement. Neither measures whether raters give the same judgement.
- Treating a label as a verdict. Writing that reliability was “substantial” without the value, the confidence interval and the number of items tells the reader very little.
- Choosing the threshold after seeing the result. Set and justify the minimum value before coding begins.
- Coders who are not independent. If the second coder sees the first coder’s codes, or the coders discuss items before coding them, the check measures conformity, not reliability.
- Reporting one pooled figure. A good overall value can hide one or two codes that coders cannot apply consistently.
- Applying kappa to continuous scores. Use an intraclass correlation, or Krippendorff’s alpha at the appropriate level of measurement.
- Equating agreement with validity. Two coders can agree consistently on a code that does not capture the concept it is meant to capture.
- Adding an agreement statistic to a reflexive analysis without explanation. If the approach treats interpretation as the researcher’s contribution, a kappa value can contradict the methodology you describe.
Inter-Rater Reliability in the Age of AI and Digital Research
Large language models can now classify text against a coding frame, and this changes the practical side of inter-rater reliability. Gilardi, Alizadeh and Kubli (2023) gave ChatGPT the same codebooks they had written for their research assistants and asked it to classify 6,183 tweets and news articles. Its zero-shot accuracy exceeded that of crowd workers by about 25 percentage points on average, and its intercoder agreement exceeded that of both crowd workers and trained annotators for all tasks. Results like these suggest that an AI model can act as a fast, cheap additional coder, but they come from specific tasks such as relevance and stance detection, not from the interpretive coding of interview data that many dissertations involve.
If you use an AI tool in coding, the logic of inter-rater reliability still applies, and it becomes more important rather than less. Treat the model as one coder and a person as another, and measure agreement between them on a sample before relying on the model for the full data set. Keep the two independent: if you review the model’s suggestions and accept most of them, the agreement you then measure is partly agreement with yourself. Record the model, version, date and full prompt, because the same prompt can produce different codes after a model update, which is a reliability problem of its own. And check your university’s rules on uploading interview data to external AI services before you do so, since participants may not have consented to it.
Digital data also change what is rated. Social media posts, product reviews and online comments often arrive in thousands, so students code a sample by hand and then apply the frame automatically or with keyword rules. The agreement check then has two parts: agreement between human coders on the hand-coded sample, and agreement between the human codes and the automated codes. Reporting only the first leaves the larger part of the data unexamined.
Exam Tip
If you are asked to evaluate a study’s inter-rater reliability, check five things in order. Was a check appropriate for the analytic approach? Were the coders independent? Was the statistic suited to the type of ratings and the number of raters? Were the threshold and the share of data double-coded set in advance and justified? And were the results reported in full, with percent agreement, the coefficient, its confidence interval and code-level results, rather than as a single label? A study that reports a modest kappa honestly, explains what was revised and retests the coding frame usually deserves more credit than one that reports “excellent agreement” with no detail.
Not sure whether your study needs an inter-rater reliability check or how to report one? Dudovskiy Research Assistant can review your research questions, planned design and analysis approach, suggest whether an agreement check fits your study and help you word it in your methodology chapter. It supports your own judgement; the final decisions remain yours and your supervisor’s.
John Dudovskiy
References
Braun, V. and Clarke, V. (2021). One size fits all? What counts as quality practice in (reflexive) thematic analysis? Qualitative Research in Psychology, 18(3), 328–352. https://doi.org/10.1080/14780887.2020.1769238
Cohen, J. (1960). A coefficient of agreement for nominal scales. Educational and Psychological Measurement, 20(1), 37–46. https://doi.org/10.1177/001316446002000104
Cohen, J. (1968). Weighted kappa: nominal scale agreement with provision for scaled disagreement or partial credit. Psychological Bulletin, 70(4), 213–220. https://doi.org/10.1037/h0026256
Feinstein, A.R. and Cicchetti, D.V. (1990). High agreement but low kappa: I. The problems of two paradoxes. Journal of Clinical Epidemiology, 43(6), 543–549. https://doi.org/10.1016/0895-4356(90)90158-L
Fleiss, J.L. (1971). Measuring nominal scale agreement among many raters. Psychological Bulletin, 76(5), 378–382. https://doi.org/10.1037/h0031619
Gilardi, F., Alizadeh, M. and Kubli, M. (2023). ChatGPT outperforms crowd workers for text-annotation tasks. Proceedings of the National Academy of Sciences, 120(30), e2305016120. https://doi.org/10.1073/pnas.2305016120
Hallgren, K.A. (2012). Computing inter-rater reliability for observational data: an overview and tutorial. Tutorials in Quantitative Methods for Psychology, 8(1), 23–34. https://doi.org/10.20982/tqmp.08.1.p023
Hayes, A.F. and Krippendorff, K. (2007). Answering the call for a standard reliability measure for coding data. Communication Methods and Measures, 1(1), 77–89. https://doi.org/10.1080/19312450709336664
Koo, T.K. and Li, M.Y. (2016). A guideline of selecting and reporting intraclass correlation coefficients for reliability research. Journal of Chiropractic Medicine, 15(2), 155–163. https://doi.org/10.1016/j.jcm.2016.02.012
Landis, J.R. and Koch, G.G. (1977). The measurement of observer agreement for categorical data. Biometrics, 33(1), 159–174. https://doi.org/10.2307/2529310
McHugh, M.L. (2012). Interrater reliability: the kappa statistic. Biochemia Medica, 22(3), 276–282. https://doi.org/10.11613/BM.2012.031
O’Connor, C. and Joffe, H. (2020). Intercoder reliability in qualitative research: debates and practical guidelines. International Journal of Qualitative Methods, 19, 1–13. https://doi.org/10.1177/1609406919899220
Shrout, P.E. and Fleiss, J.L. (1979). Intraclass correlations: uses in assessing rater reliability. Psychological Bulletin, 86(2), 420–428. https://doi.org/10.1037/0033-2909.86.2.420
Last reviewed: November 2026.